创业板在市场上占比也是比较重要的,同时它也有与其他指数代表不一样的意义。创业板代表着科技股的市场走势。为此,我们必须也要对创业板进行单独的指数样本内进行选股模型研究,并分享各位读者研究参考或指导。创业板综样本内的增强策略,通过是否包含小市值权重可以划分为:蓝筹股多因子选股策略和小市值多因子选股策略。顾名思义,蓝筹股选股策略就是策略选股绝大多数为蓝筹股或大市值股票,而小市值多因子选股策略,比较类似微盘股选股策略,选股模型包含小市值权重。
本篇只研究大市值或蓝筹股多因子选股策略,具体结果如下:
回顾:如何搭配因子组合 的策略心得,并总结出一条相应的参考规律:
线性选股评分模型 = 成长因子(权重系数:建议20-40%) + 经营质量因子(权重系数:建议20-40%) + 估值因子(包括市值因子)(权重系数:建议20-40%)
其中,估值因子必须要考虑,主要是考虑到逆向操作的行为,相等于它可以快速指导我们根据市场变化进行低买高卖操作,而成长因子和经营质量因子更多是根据每一个最新财报公布数据告诉我们那些股票样本空间更容易实现被买入或持仓,对低买高卖的操作几乎没有影响,并不是直观反应的指标。
上三次共享了沪深300、中证500、中证1000、国证2000指数增强和微盘股的选股模型,这一次,我再分享一下创业板蓝筹股的选股模型,其选股模型过去5年多的年化收益率明显与沪深300比较相近或类似、但比中证500、中证1000和国证2000的指数增强和微盘股策略的差,并换手率并不高。
以下是今天特意尝试共享部分有效的多因子线性选股评分模型(不限于全市场样本空间),用于与各位量化爱好者共同参考学习:
策略实现的过程的步骤如下:
1、创业板综成分股作为股票池;
2、剔除ST、停牌的股票;
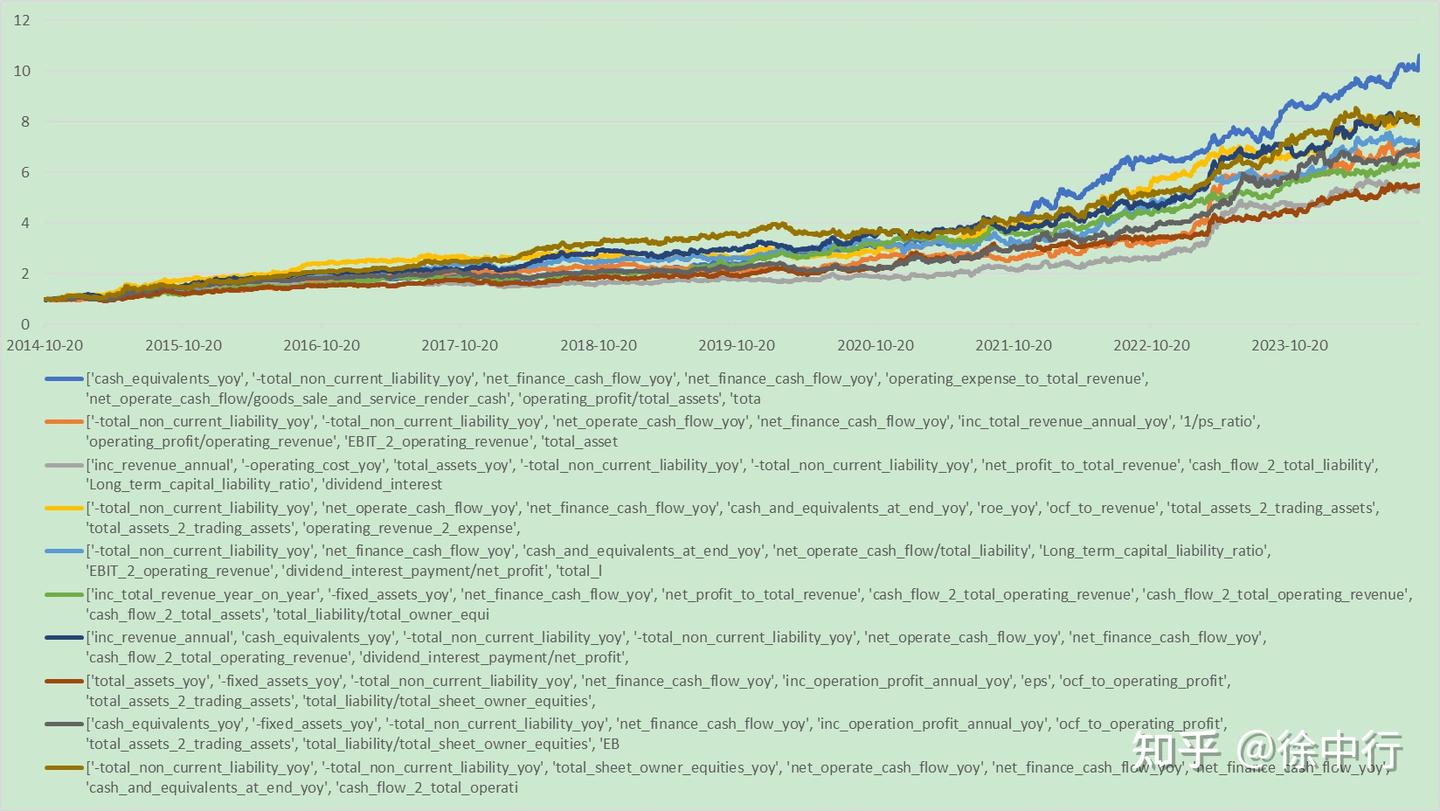
3、10因子的线性模型构建,参考模型如下:
第一组因子评分模型:point = ['cash_equivalents_yoy', '-total_non_current_liability_yoy', 'net_finance_cash_flow_yoy', 'net_finance_cash_flow_yoy', 'operating_expense_to_total_revenue', 'net_operate_cash_flow/goods_sale_and_service_render_cash', 'operating_profit/total_assets', 'total_liability/total_owner_equities', 'total_liability/total_sheet_owner_equities', 'operating_revenue_2_expense'];
第二组因子评分模型:point = ['-total_non_current_liability_yoy', '-total_non_current_liability_yoy', 'net_operate_cash_flow_yoy', 'net_finance_cash_flow_yoy', 'inc_total_revenue_annual_yoy', '1/ps_ratio', 'operating_profit/operating_revenue', 'EBIT_2_operating_revenue', 'total_assets_2_trading_assets', 'operating_revenue_2_expense'];
第三组因子评分模型:point = ['inc_revenue_annual', '-operating_cost_yoy', 'total_assets_yoy', '-total_non_current_liability_yoy', '-total_non_current_liability_yoy', 'net_profit_to_total_revenue', 'cash_flow_2_total_liability', 'Long_term_capital_liability_ratio', 'dividend_interest_payment/net_profit', 'total_assets_2_trading_assets'];
第四组因子评分模型:point =['-total_non_current_liability_yoy', 'net_operate_cash_flow_yoy', 'net_finance_cash_flow_yoy', 'cash_and_equivalents_at_end_yoy', 'roe_yoy', 'ocf_to_revenue', 'total_assets_2_trading_assets', 'total_assets_2_trading_assets', 'operating_revenue_2_expense', 'dividend_interest_payment/market_cap'];
第五组因子评分模型:point =['-total_non_current_liability_yoy', 'net_finance_cash_flow_yoy', 'cash_and_equivalents_at_end_yoy', 'net_operate_cash_flow/total_liability', 'Long_term_capital_liability_ratio', 'EBIT_2_operating_revenue', 'dividend_interest_payment/net_profit', 'total_liability/total_owner_equities', 'operating_revenue_2_expense', 'roa'];
第六组因子评分模型:point = ['inc_total_revenue_year_on_year', '-fixed_assets_yoy', 'net_finance_cash_flow_yoy', 'net_profit_to_total_revenue', 'cash_flow_2_total_operating_revenue', 'cash_flow_2_total_operating_revenue', 'cash_flow_2_total_assets', 'total_liability/total_owner_equities', 'operating_revenue_2_expense', 'retained_profit/capitalization'];
第七组因子评分模型:point = ['inc_revenue_annual', 'cash_equivalents_yoy', '-total_non_current_liability_yoy', '-total_non_current_liability_yoy', 'net_operate_cash_flow_yoy', 'net_finance_cash_flow_yoy', 'cash_flow_2_total_operating_revenue', 'dividend_interest_payment/net_profit', 'total_assets_2_trading_assets', 'roe'];
第八组因子评分模型:point = ['total_assets_yoy', '-fixed_assets_yoy', '-total_non_current_liability_yoy', 'net_finance_cash_flow_yoy', 'inc_operation_profit_annual_yoy', 'eps', 'ocf_to_operating_profit', 'total_assets_2_trading_assets', 'total_liability/total_sheet_owner_equities', 'net_operate_cash_flow/capitalization'];
第九组因子评分模型:point = ['cash_equivalents_yoy', '-fixed_assets_yoy', '-total_non_current_liability_yoy', 'net_finance_cash_flow_yoy', 'inc_operation_profit_annual_yoy', 'ocf_to_operating_profit', 'total_assets_2_trading_assets', 'total_liability/total_sheet_owner_equities', 'EBIT/financial_expense', 'net_operate_cash_flow/capitalization'];
第十组因子评分模型:point = ['-total_non_current_liability_yoy', '-total_non_current_liability_yoy', 'total_sheet_owner_equities_yoy', 'net_operate_cash_flow_yoy', 'net_finance_cash_flow_yoy', 'net_finance_cash_flow_yoy', 'cash_and_equivalents_at_end_yoy', 'cash_flow_2_total_operating_revenue', 'total_assets_2_trading_assets', 'fixed_assets/market_cap'];
今天就分享十组有效的因子评分选股模型,其中评分过程都是进行等权排序评分法实现;
比如第一组因子模型,我们如何使用呢?我们先看看因子组合的显示格式:['inc_revenue_year_on_year', 'total_owner_equities/total_liability', 'net_operate_cash_flow/capitalization', '1/pb_ratio_yoy'],我们会发现因子组的具体结构如下:point = [factor1,...,factorM]。因此,我们可以很明确的看到,因子组模型是对factor1,....,factorM的单独子因子组进行等权排序评分,这样我们可以得到一个最终的多因子线性选股评分,也就是point,那么我们对其进行由大到小排序,买入前N只股票即可;
4、每天开盘前进行评分,买入前20只股票作为持仓,均等持仓,手续费和印花税按交易所标准设置;
5、回测时间段为2014年10月-2024年9月;
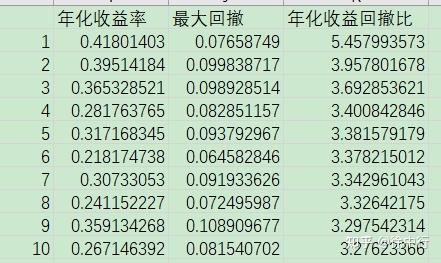
6、以上十组因子评分模型,年化收益率绝大多数都超过30%。
特别说明:以上因子数据皆为聚宽量化平台的,可以再聚宽平台重现
系列文章:
徐中行:共享选股模型之一:沪深300增强线性选股评分模型,年化收益率超过35%
徐中行:共享选股模型之二:中证500增强线性选股评分模型,年化收益率超过40%
徐中行:共享选股模型之三:中证1000增强线性选股评分模型,年化收益率超过50%
精选文章链接:
2、量化研究徐中行:策略开发思想:股票价格是非稳态系统? 如何通过逐步提升系统稳态性而升华投资方案?
